 校长信箱:cj8101@163.com
对话与思考:如何提升你的数学思维?

自然界与现实社会,在诸多方面展现着数学思维的运用。但是在教学中,怎样将现实问题转化到数学课堂?以何种视角建构起现实问题与数学问题之间的联系?
苏城外国语学校高中部的数学课堂有着属于自己的阐释与演绎。
The application of Mathematics can been seen everywhere in the real world. The Mathematics class in the SCFLS senior high school has its own interpretation for turning real-life questions into Maths problems, and the connection between these two.
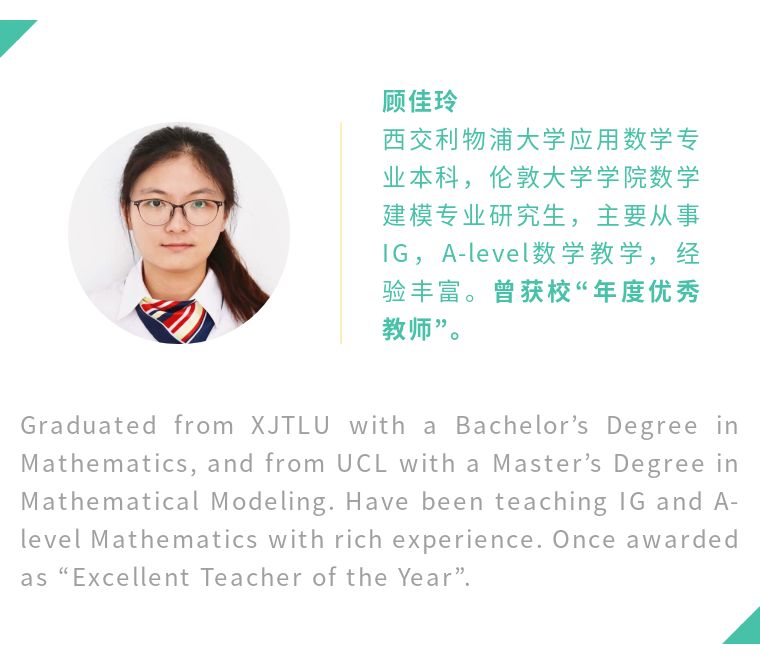
教师简介 Teacher Profile
在这节课之前,学生已经学习了一些关于直线的基本知识,比如如何求直线的表达式,斜率的意义,如何通过表达式画出对应直线等。
教学目标:
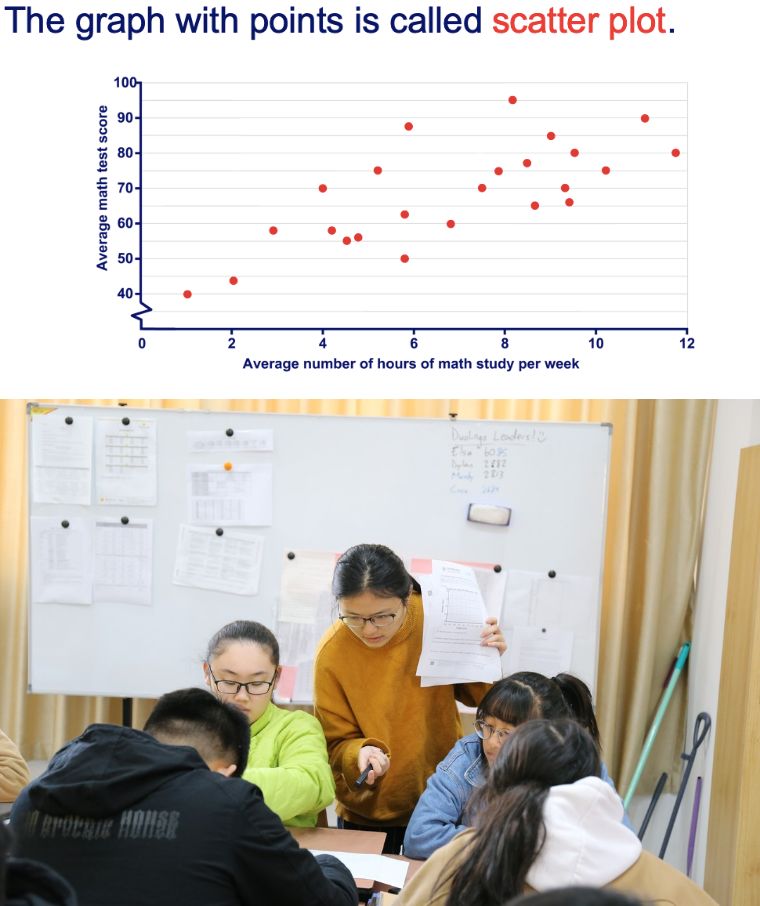
读懂散点图,通过数据画出散点图。
在散点图中找出最佳拟合直线,并求出表达式。
Before this class, students have had some prior knowledge, for example: how to find the linear function, the meaning of slope and how to draw the corresponding line of a given function. Based on these, the teaching objectives are:
To understand and draw the scatter plot of given data.To find the line of best fit for the scatter plot and find the equation
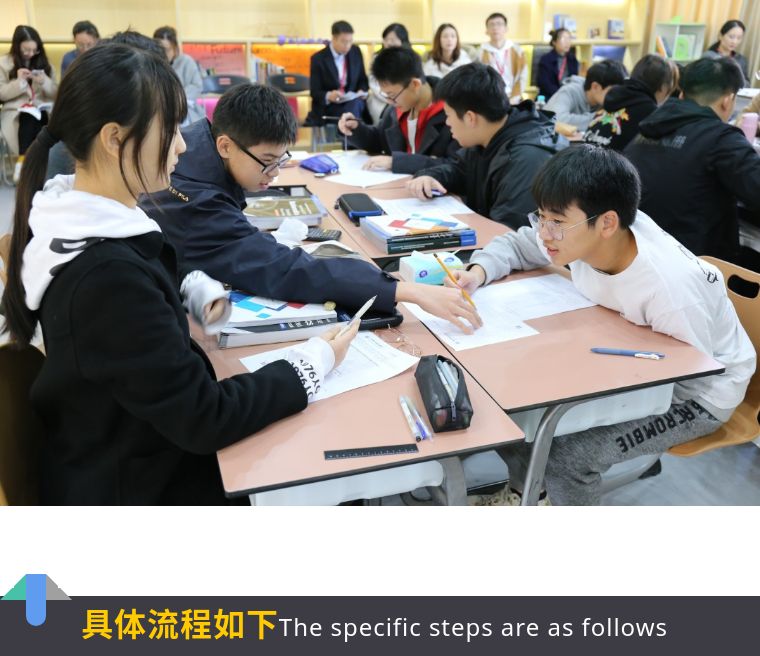

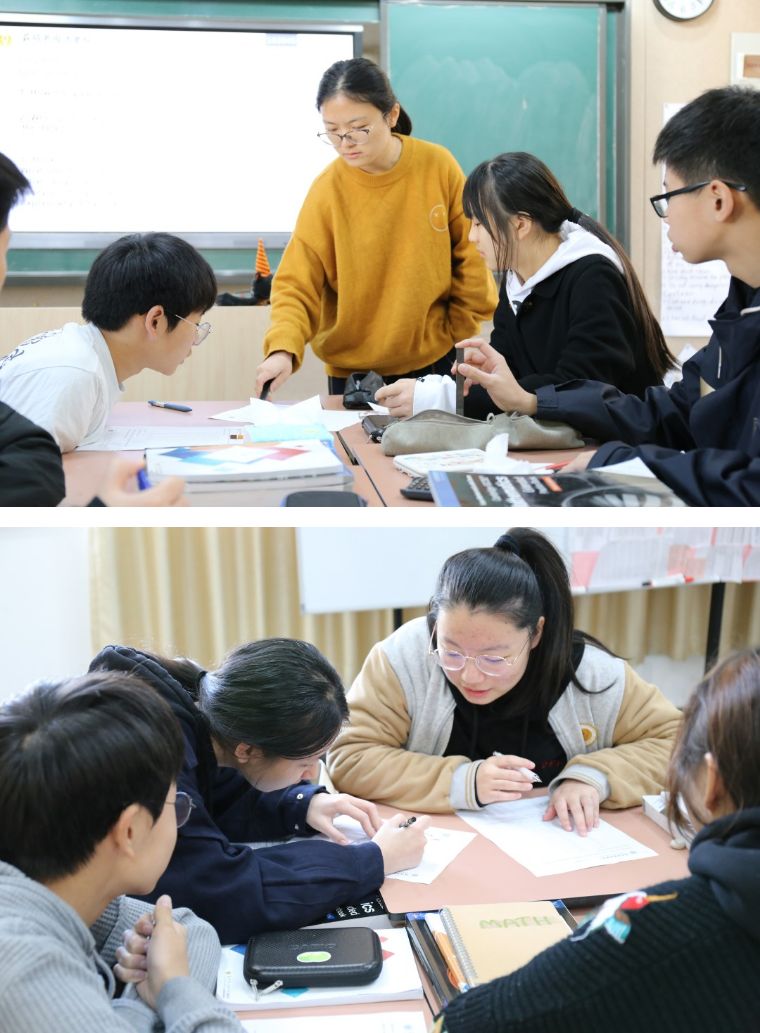
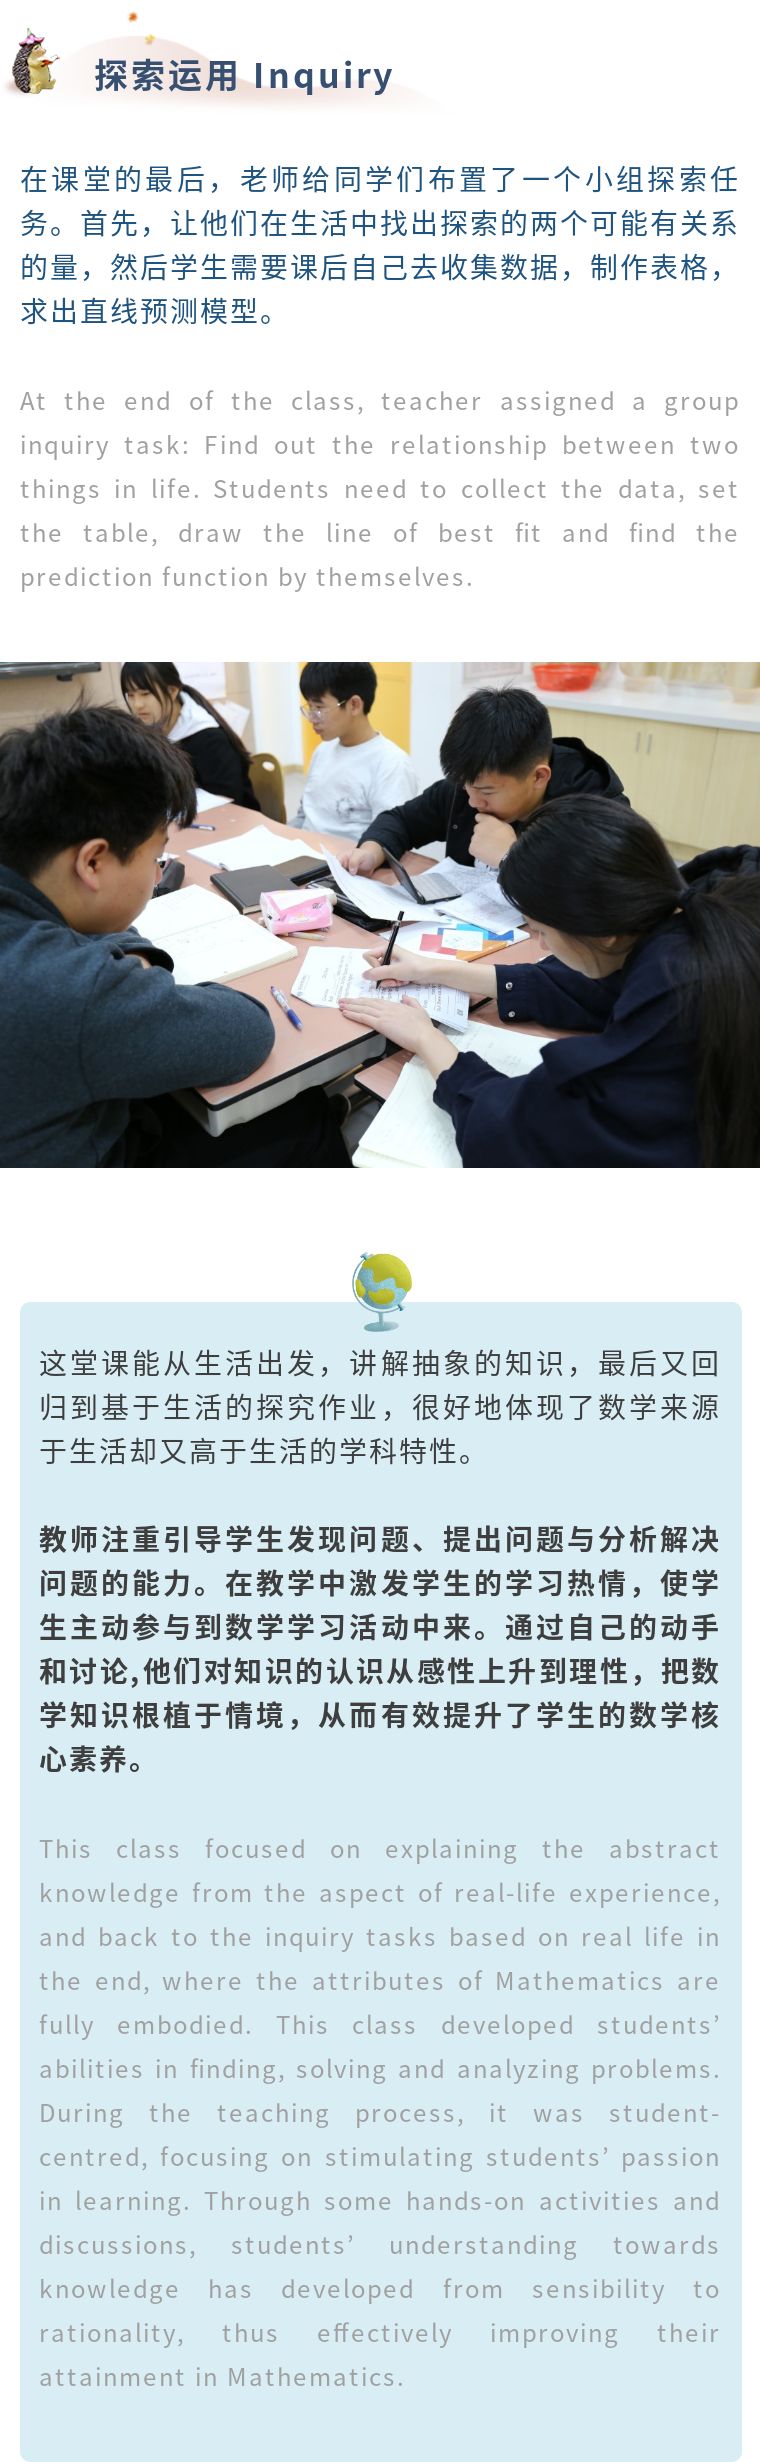
教师呈现出一组关于学生每周学习数学的时间和学生期中考试成绩的数据,引导学生根据这一组数据画出散点图。然后让每一组学生思考这一组数据两个量之间的关系和如何能够添加辅助线来描述这两个量之间的趋势,并同时在纸上画出,以此来锻炼他们作为Inquirers,Thinkers的能力。
Teacher presented a set of data about students’ weekly study time in math and the mid-term math score of each student, guiding students to draw the scatter plot based on the given data. After that, students were encouraged to think what could be added to describe the trend between these two variables and show it on paper. Through this activity, they were trained to be inquirers and thinkers.

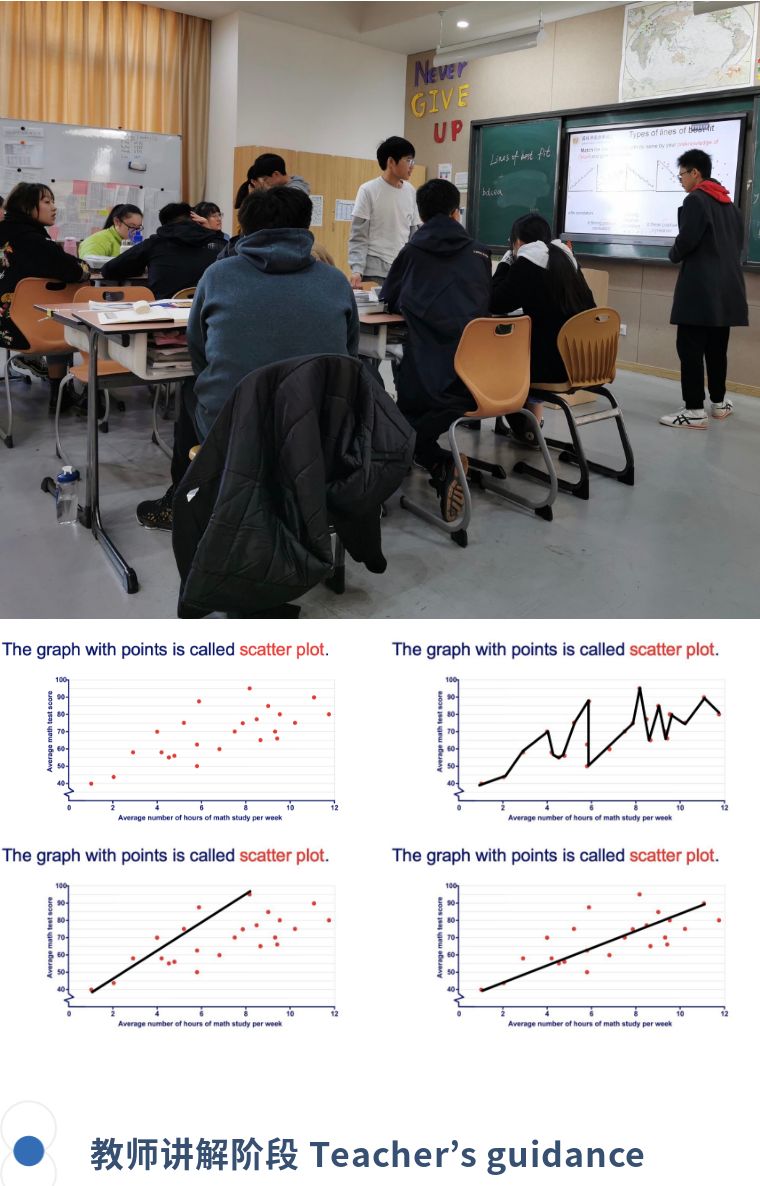
同学们经过思考得出不一样的结论,老师在黑板上展示了几张不同的答案,同学们也相互讨论,投票选出他们认为最能描述两个量之间趋势的图,在这一过程中,充分展现了学生们communicators与open-minded的特质。
After discussion, different answers were presented by teacher on the blackboard. Students had to justify their answers and voted for the best graph, demonstrating their abilities as communicators and open-minded.
老师提取同学们讨论中的关键信息,正是这一节课的教学重点,并延伸开去讲解如何挑选最佳拟合直线,什么是预测函数,如何求解预测函数,如何利用预测函数来解决实际问题。老师精当的讲解可以让学生更加knowledgeable。
Teacher extracted the key point of student’s discussion and extended to the topic: how to choose the line of best fit and prediction function and applications in real life. Students will be more knowledgeable with teacher’s explanation.
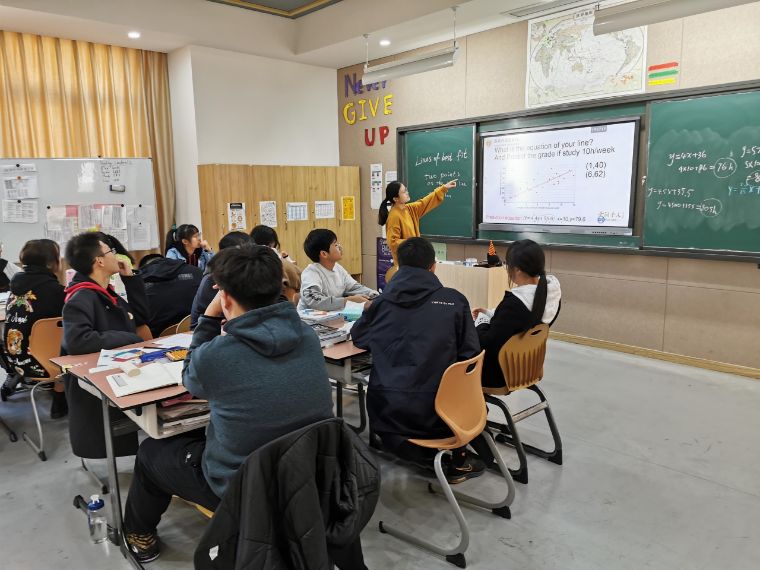

教师在课堂中对学生进行再次分组,从原来有利于促进讨论的异质分组换为同质分组,根据每组学生不同的学习能力分配难度不同的习题,能力最强的一组除了基础的练习,会补充更开放的思考题。
Students were regrouped according to homogeneous intelligences, and assigned with tasks of different levels. The higher-level group had more open-ended questions apart from some basic problems.
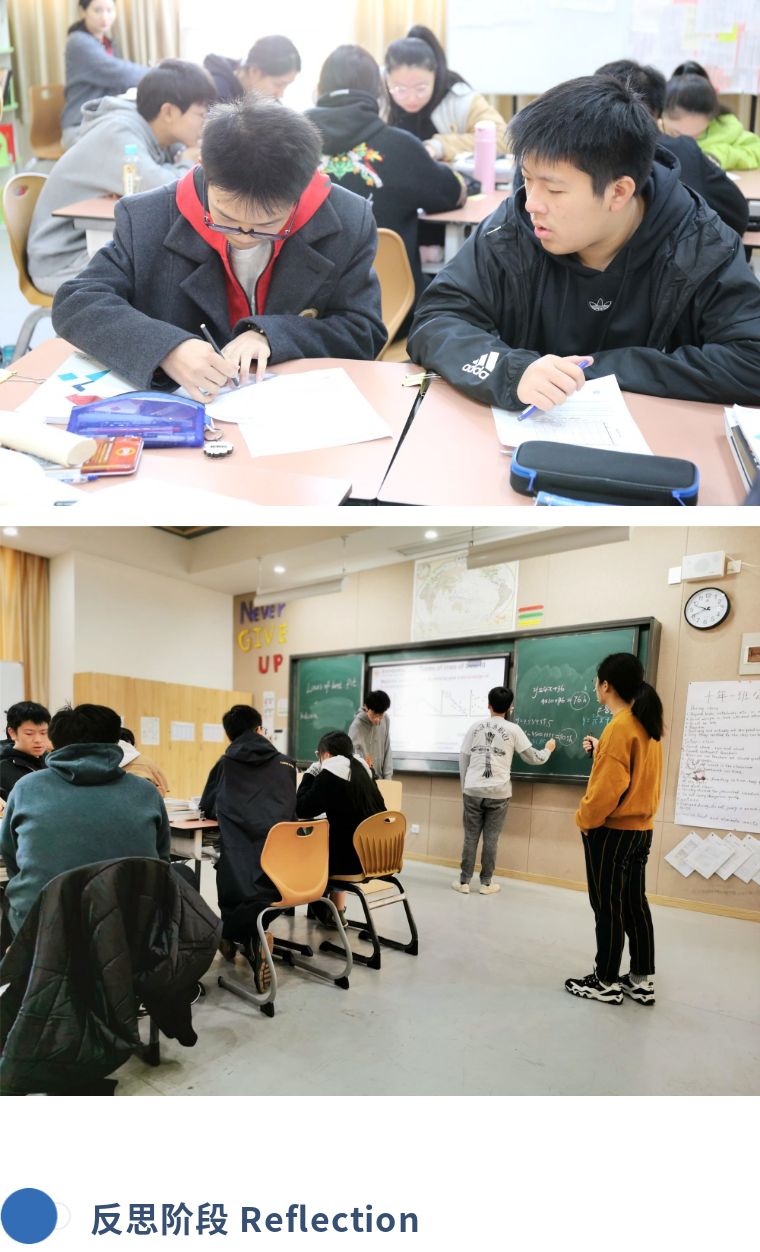
任何的数学模型都有它的局限性,这节课学习的直线预测模型也不例外。学生要结合他们这堂课的学习知识和现实生活经验来思考直线模型的局限性。直线模型只能用来预测一定范围内的数据,当自变量很大时就会变得不准确。比如学习的时间变长,成绩也不会超过试卷的满分;也可能直线模型并不是描述关系的最佳选择。
Restrictions exist in any mathematical model, so does the model in this class. Students discussed the restriction based on the real-life experience and knowledge in this class. Here are some possible answers: the linear prediction function only works in a suitable range; the linear model is not the best choice.
中文撰稿:顾佳玲
英文翻译:沈紫烟
摄影:宋柏霖
英文审核:语言中心
编辑、排版、审核:校长办公室 宣传办
 招生热线:0512-89180556 / 89180555
  应聘邮箱:hr@cscfls.com
 学校地址:苏州市相城区金砖路399号